How to start?
1.
After launching the product, the SpinRCP's splash screen appears first and then the
Workspace Launcher dialog prompts you for what workspace to use for this session. A workspace
is a folder where SpinRCP stores your projects. According to a platform, a default workspace is
set in your home directory. The dialog will allow you to browse for or manually enter a new
workspace location. After clicking the OK button, the chosen workspace with
the default SpinRCP perspective opens. If there exists any previously created workspace, you may just select and reuse
it. Note: Reuse of an existing workspace created with
SpinRCP Version 2.x.x within SpinRCP Version 3.x.x is not possible. In this case, create a
new workspace and copy the existing projects thereinto.
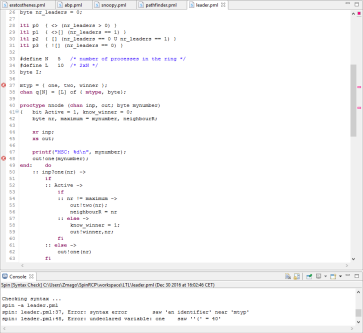
In the Title Bar, the SpinRCP's version and release date are shown. If the path to Spin is
already set in the PATH environment variable, the Spin version and its release date are shown
as well. Below the Title Bar, the Menu Bar, and the Tool Bar there are three visual components:
a Model Navigator View at the left side, a Promela Editor at the upper right side, and a Console
View at the bottom right side. The Model Navigator View is activated. If you move a cursor on
its highlighted title bar, a tooltip Workspace appears. This means that the Model Navigator
shows the contents of your workspace folder. It is empty if the workspace was newly created.
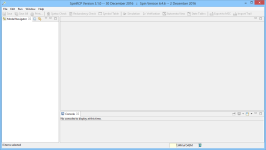
The default SpinRCP perspective
You can rearrange the layout of SpinRCP's windows by dragging and dropping views and editors to
different positions within the Workbench window, resize them by dragging the sashes which
separate them, or even detach any window by dragging and dropping it outside the Workbench.
A detached window is very useful if you have two monitors and you maximize it to the full screen
on the second monitor. Any detached window can be attached back to an arbitrary position within
the SpinRCP's Workbench window by using drag and drop operation again.
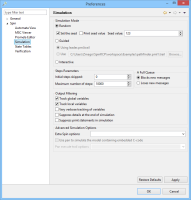
2.
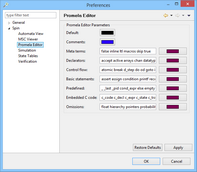
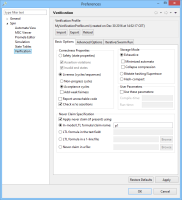
SpinRCP needs to know the paths to three external tools: Spin, C compiler, and Graphviz dot.
It is highly recommended that you update the PATH environment variable of your system with the
paths to these external tools. Set these paths in SpinRCP by opening the Spin preference page
Window > Preferences > Spin and enter or select individual paths using Browse... buttons.
If the PATH environment variable of your computer system includes paths to Spin, C compiler,
and Graphviz dot, you don't need to enter their absolute paths but just their names (e.g.,
spin, gcc,
dot). The default path to Spin is preset to
spin. If you have given the Spin executable a
different file name, change the path accordingly. In addition to the latest Spin version you may
have installed some of its previous versions (e.g. Spin Version 5.2.5, Spin Version 6.1.0, and
Spin Version 6.4.3 under file names titled spin525,
spin610, and spin643, respectively) in your
Spin directory. To analyze your models with different versions of Spin, switch between
versions by either entering or selecting the chosen executable file name into the Spin path text
field. Paths with spaces are also allowed. SpinRCP handles them correctly.
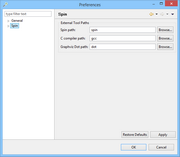
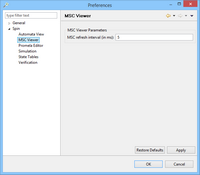
Spin preference page